Enterprise Analytics
Enhancing Customer Retention to Drive Revenue Growth
A redesign of the Analytics & Benchmarking platform for Human Capital Management (HCM) to enhance user experience, improve data accessibility, and provide actionable insights for HR professionals and business leaders.
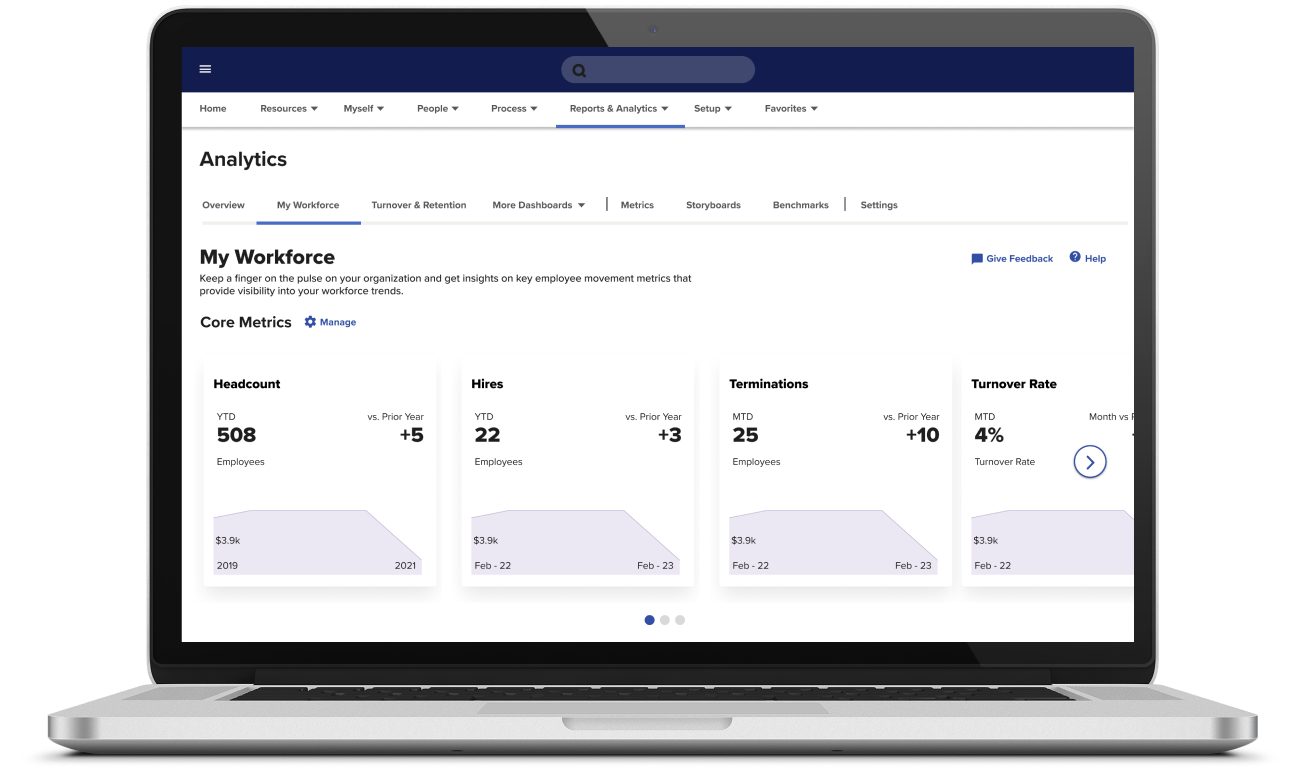
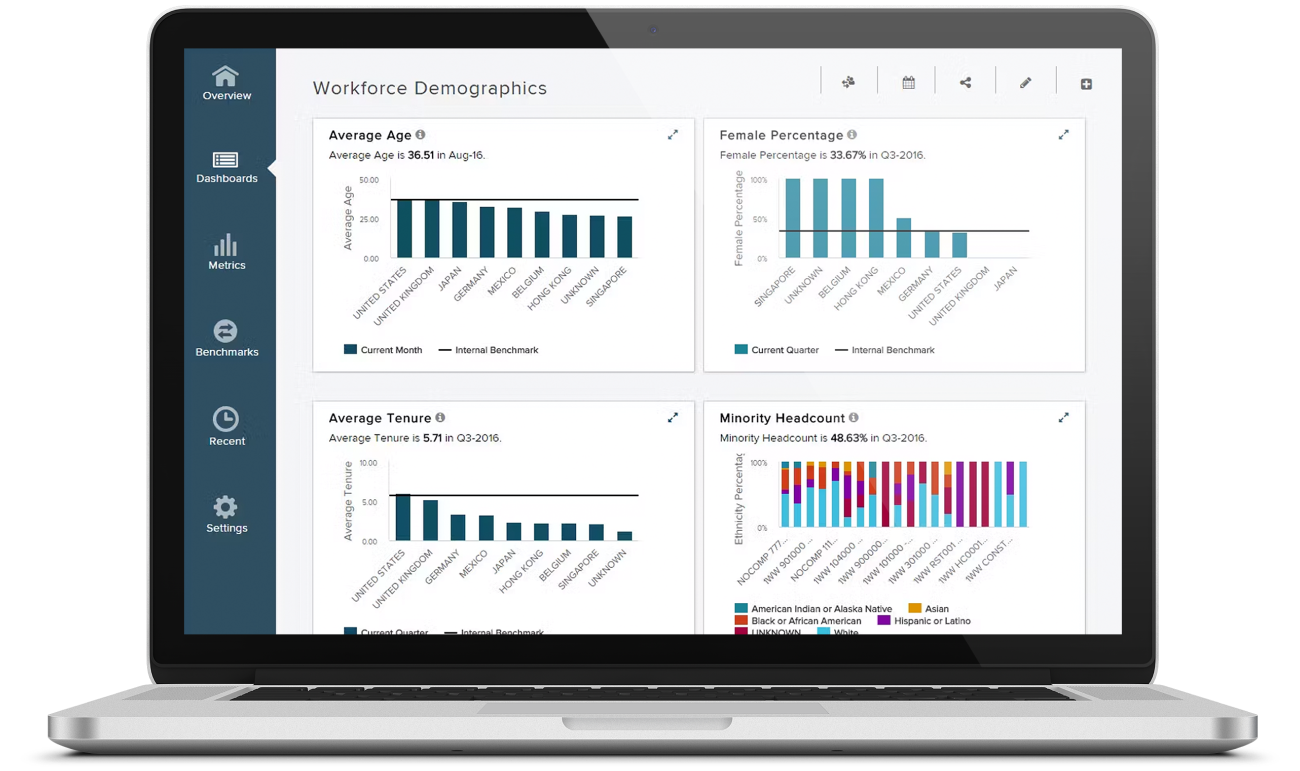
Drag to compare: legacy dashboard (before) vs. redesigned, story-driven dashboard (after)
The Challenge
HR practitioners struggled to uncover actionable insights due to an outdated information architecture. Dashboards lacked context and failed to convey the "so what" factor, especially for less experienced users.
My Solution
Led a redesign of the information architecture — shifting from a product-focused structure to a thematic, problem-solving framework with story-driven, guided dashboards.
The Impact
- 65% decrease in client churn, YoY
- CSAT score improvement, 2.5 → 4.1 (client sentiment)
- 30% increase in active users, first 3 months
Research & Discovery
Grounded in stakeholder and practitioner input
Workshops with executives and strategic partners defined the core problem; user research and usability testing validated the direction before a single wireframe was finalized.
- Executive & strategic partner workshops
- User personas & problem statements
- UserZoom-moderated usability testing
- Low-fidelity wireframe testing
- Task-based evaluative research
Key Findings
Complex Information Architecture
Novice users found interfaces confusing, causing frustration and inefficiency.
Overwhelmed by Data Volume
Users struggled to pinpoint key insights within the volume of available data.
Lack of Contextual Knowledge
Non-HR managers struggled to apply insights, limiting dashboard effectiveness.
See full discovery detail — personas & additional friction points
Analyst Andrew — HRIS Administrator (31, Bachelor's)
"I'm the main point of contact between ADP and our company. If I make an error because features are confusing, it affects the rest of the company."
Practitioner Patricia — HR Generalist (27, Bachelor's)
"I struggle with operational dashboards that are cluttered and unintuitive, forcing extra time on manual analysis."
Executive Edward — CFO (45, Master's)
"I don't have time to spend hours in the system. I need to access data quickly and understand business implications without a lot of digging."
Arduous Implementation Cycles
Long, complex implementation processes made it difficult to retain critical information.
Dashboard Customization Challenges
Tailoring dashboards to different business divisions required significant time and effort.
Difficulty Customizing Dashboards
Novice users struggled to tailor dashboards to relevant data.
Design Process
From discovery to development handoff
Understand
Workshops and persona research defined the core problem.
Define
Reframed the IA around practitioner themes, not product structure.
Design
Wireframed and prototyped themed, story-driven dashboards.
Validate
Alpha and beta tested with clients, iterating on the design system.
Deliver
Finalized detailed designs, ready for development handoff.
The Redesigned Experience
Themed dashboards built around real HR questions
Guided dashboards tailored to key issues identified by subject matter experts, with a dedicated core-metrics area and a question-and-answer starting point aligned to formal analysis best practices.
- Guided, theme-based dashboards
- Dedicated core-metrics area
- Preconfigured question-and-answer tabs
- Modular, customizable metric tile components
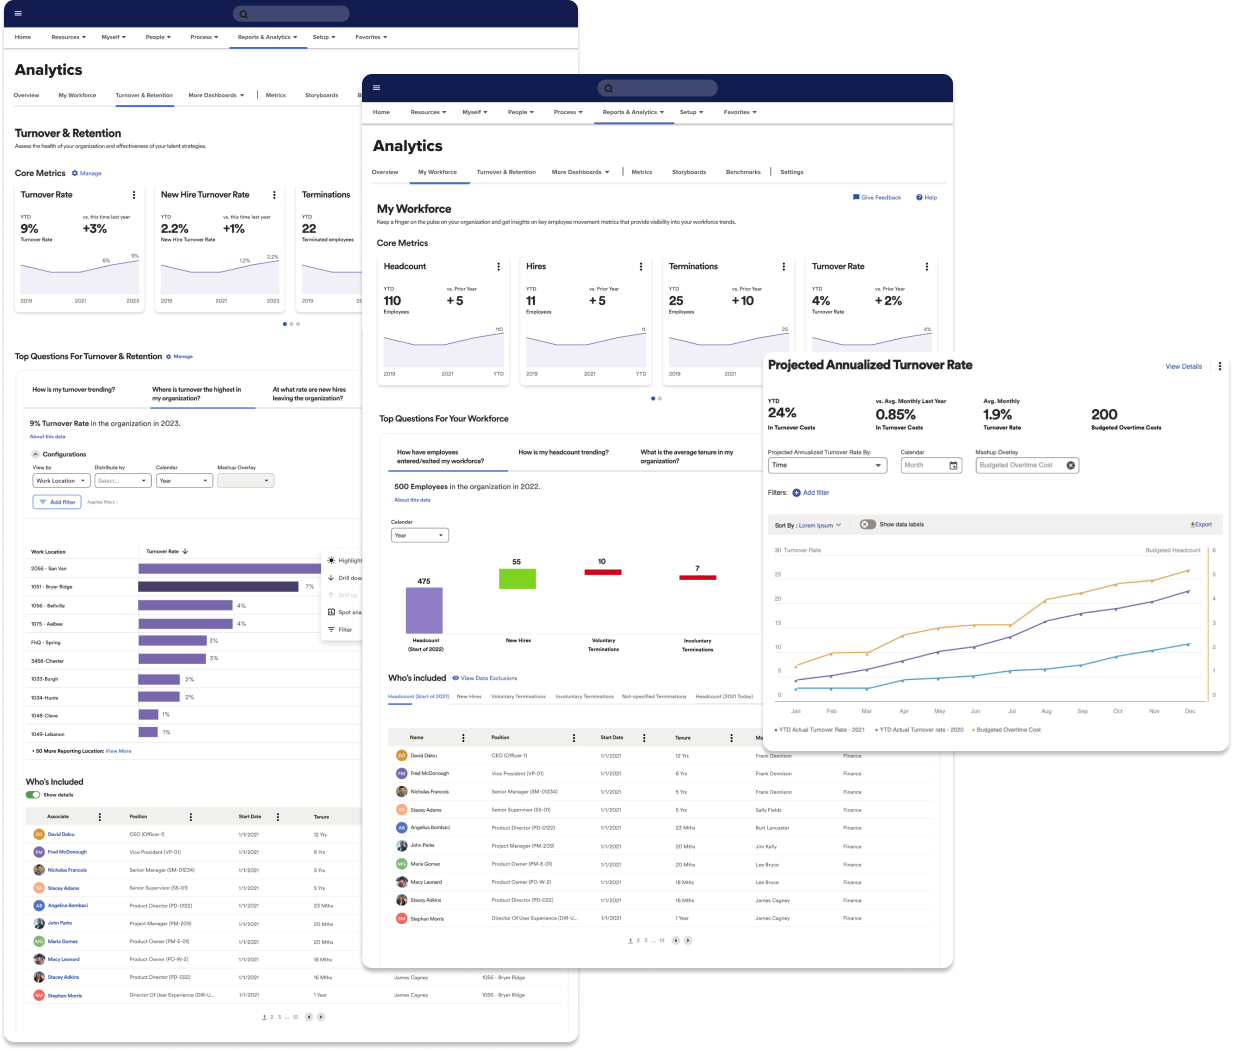
Themed Turnover & Retention dashboard, ADP Analytics
The Outcomes
Additional Use Cases
More case studies
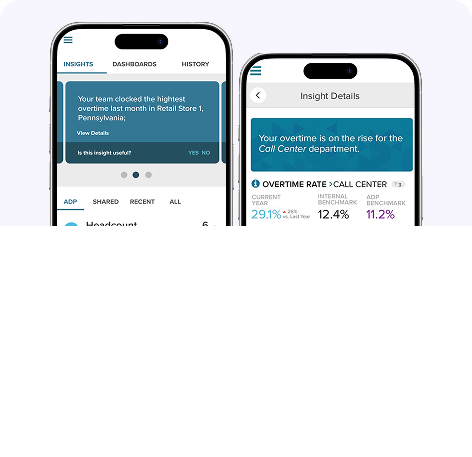
Creating a Seamless Multi-Platform User Experience
Redesigned Executive Manager Insights for mobile, reaching UX parity with desktop.
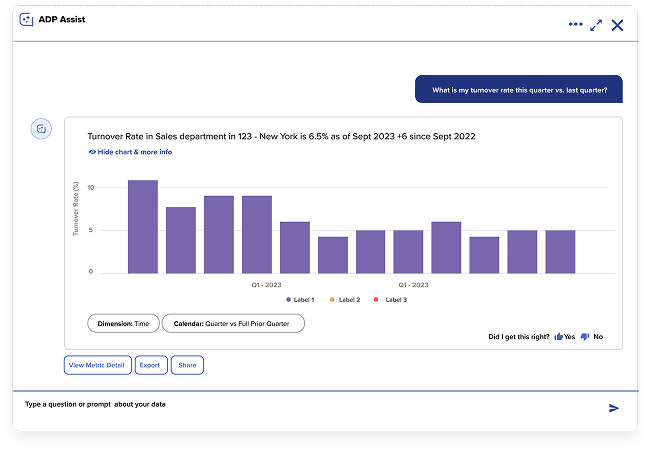
Optimizing Operational Efficiency with Generative AI
Ground-up product vision for an NLP-driven analytics assistant for HR and Payroll practitioners.